| HOME | FEEDBACK |
|
|
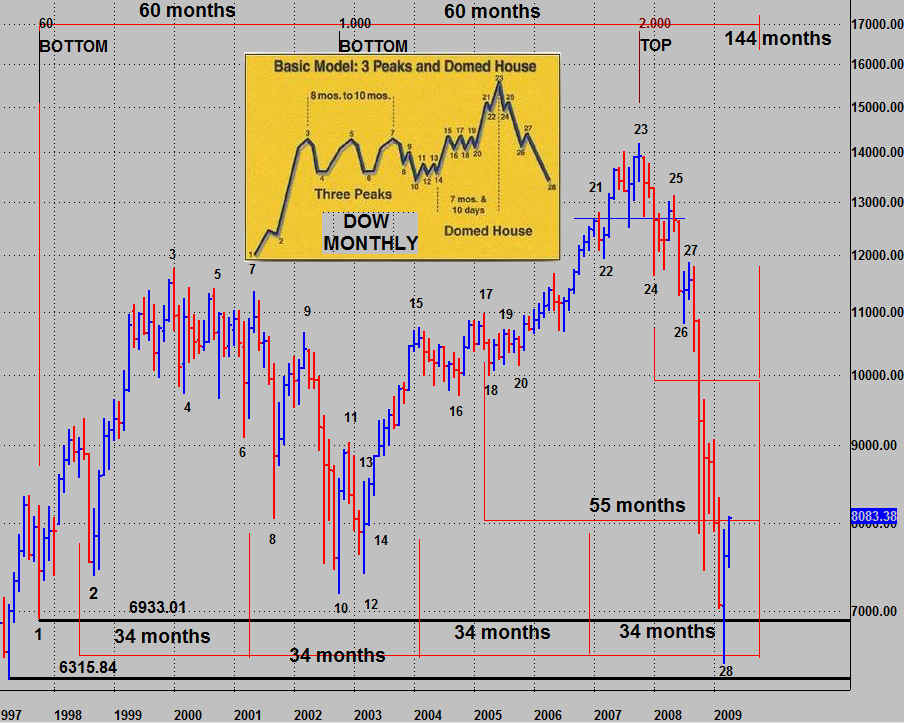
THE GEORGE LINDSAY 3 PEAKS DOMED HOUSE PATTERN THAT I HAVE BEEN FOLLOWING HERE IS CONSIDERED COMPLETE , THIS IMPLIES A NEW DEVELOPING PATTERN . THIS PAGE IS FOR LONG TERM PATTERNS AND THIS ONE WAS 10 YEARS IN THE MAKING . THIS PATTERN COMPLETED IN MARCH 2009 CHART UPDATED APRIL 11 2009
BACK IN 1999 AND 2000 WHEN I WAS FIRST INTRODUCED TO THIS PATTERN BY JERRY FAVORS HE HAD POINT 10 AT 7400 ON THE DOW . SO THE EXPECTATION OF A MOVE TO 7400 BACK TO PT 10 SEEMED TO PROVE THE PATTERN HAD COMPLETED AND WHAT WE GOT WAS THE PT 24, 25 26 DROP INTO OCT 2002 . WELL THAT ALL MADE SENSE FOR A WHILE . YET THE PICTURE CHANGED AND BECAUSE OF IT IM ALSO CHANGED MY MODEL BACK IN 2004. I OWE CREDIT TO JERRY FAVORS FOR INTRODUCING THIS PATTERN TO ME . I MISSED THE UPDATES ALONG THE WAY HERE ON THIS PAGE YET THE PATTERN IS NEAR COMPLETION IF NOT COMPLETED IDEALLY ID LIKE TO SEE A MOVE BELOW 7197 TOWARDS 6200 YET AS IT STANDS WE SHOULD GIVE SOME CREDIT TO THIS PATTERN AS COMPLETE ( SEE CHART BELOW FOR THE MORE BEARISH COMPLETION OF THIS PATTERN ) . CHART UPDATE APRIL 11 2009
MARCH 21 2010 I KEEP THE CHARTS BELOW AS A REFERENCE TO HOW THIS PATTERN HAS BEEN TRACING OUT . CURRENTLY THE BEST LABELING PLACES THE DOW IN POINT 28 .
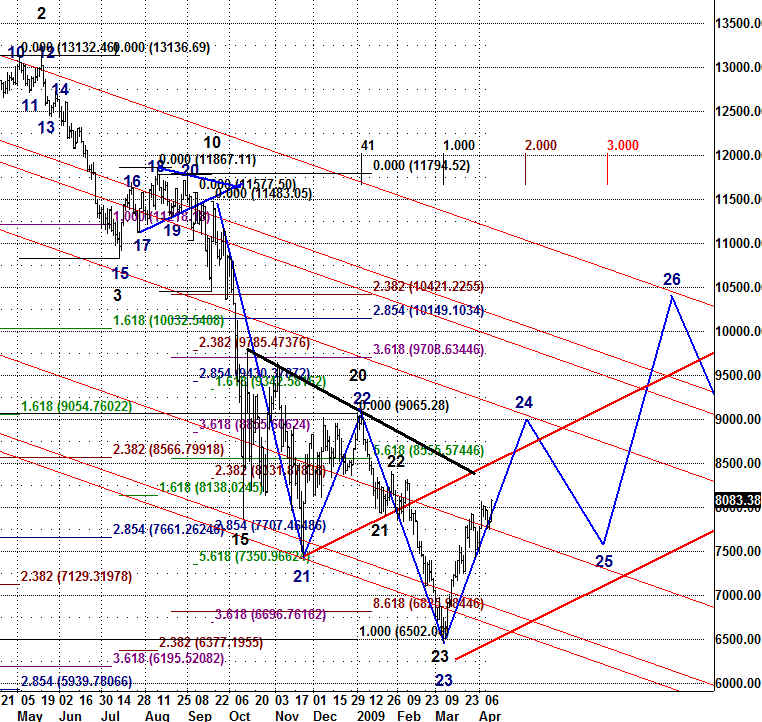
NOV 27 2008 AS NOTED ABOVE THE 3 PEAKS DOMED HOUSE IS CONSIDERED COMPLETE AS IT HAS COME BACK AND TESTED THE POINT 10 LEVEL AT 7197 ( THE OCT 2002 LOWS ) , HOW EVER FROM THE TOP IN OCT 2008 I HAVE BEEN FOLLOWING THIS PATTERN IN UPSIDE DOWN . POINT 21 WAS MOST LIKELY THE NOV 21 2008 LOW WHICH IMPLIES WE ARE IN THE PROCESS OF PUTTING IN A HEAD AND SHOULDERS BOTTOM FORMATION .POINT 22 SHOULD END IN THE PRICE TERRITORY OF 9708 - 10421 . THEN A HARD DROP FOR POINT 23 AROUND 6200 ( THE HEAD ). FROM THE POINT 23 LOW NEAR 6200 WE WOULD THEN LOOK FOR A MOVE BACK TO POINT 10 ( NEAR 13000 ) APRIL 11 2009 THIS PATTERN FORMED ITS BOTTOM IN MARCH 2009 , WE SHOULD SEE A HIGHER LOW AND A LONGER TERM HEAD AND SHOULDERS BOTTOM FORM TO GIVE US CONFIRMATION THAT A LONG TERM BOTTOM WAS COMPLETED IN MARCH 2009 . THE 7500 PRICE LEVEL WILL BECOME SUPPORT IF THIS PATTERN IS GOING TO CONTINUE .
OLD CHART
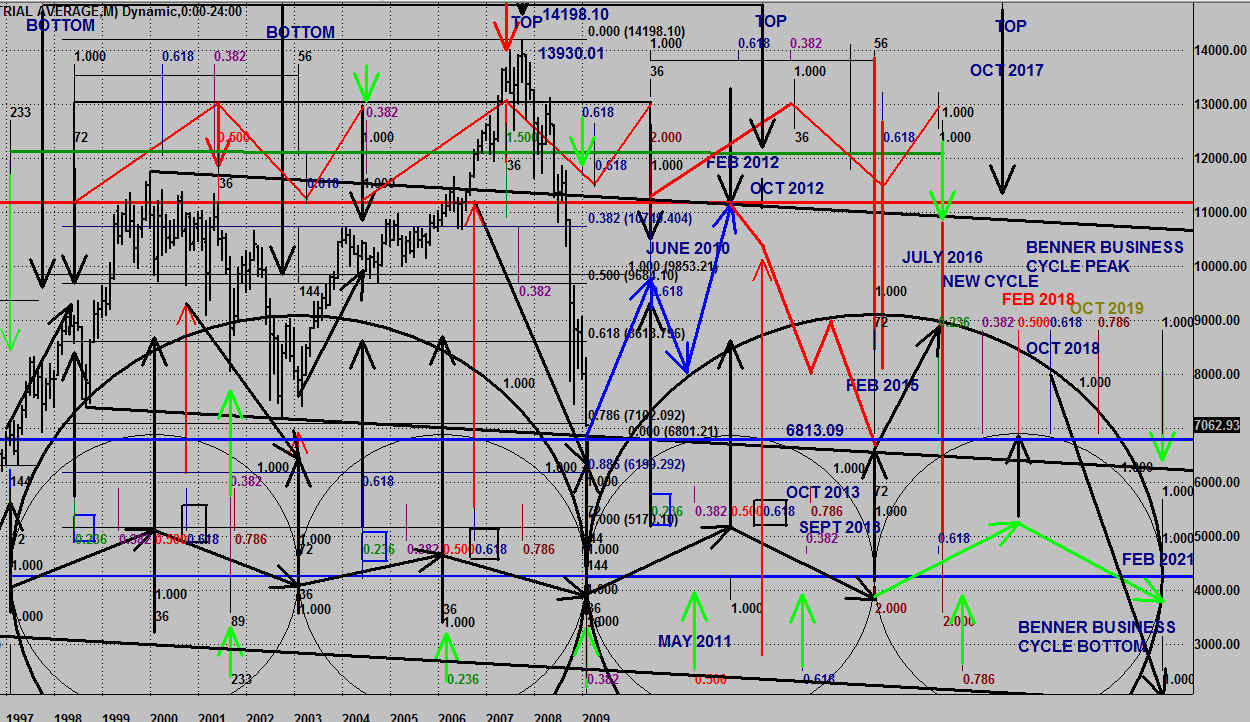
THE INVERTED 3 PEAKS DOMED HOUR PATTERN WILL TAKE A LONG TIME TO PROVE ITSELF . THIS IS HOW THIS WOULD LOOK OVER THE NEXT 10 YEARS ROUGHLY IF WE DID NOT SEE A MAJOR BOTTOM IN MARCH 2009.( SOMETIMES EVEN LARGER BEARISH PATTERN STILL HAVE PLENTY OF UPSIDE IN THEM )
HERE IS AN EXPLANATION : Sand Spring Advisors LLC AUTHOR : Barclay T. Leib JAN 2000 (http://www.sandspring.com/articles/tp.html ) Lindsay characterized the "three peaks" process as one of rapid advances in brief spurts between which the market goes through long stretches of consolidation. The tops are typically somewhat "rounded or flat," and the tops usually occur within a similar price range perhaps with a slight upward bias. According to Lindsay, the entire "three peaks" process typically lasted eight months. After the third peak (at point 7), a rather severe downtrend begins. It is called the "Separating Decline" because it separates the "Three Peaks" from the formation that follows. This decline usually encompasses at least two selling waves, labeled from point 7 to point 8, and point 9 to point 10. The decline eventually achieved at point 10 is always at a lower level than either point 4 or point 6, and usually lower than both. Unless at least one of these lows is broken, one cannot label this formation as a "Separating Decline." A new advance and overall formation begins after point 10. It is the beginning of Lindsay's "Domed House." After a sharp reverse from the point 10 low, first there is a small requisite double test of that low. This transpires during the period labeled points 12 and 14 (which in traditional Elliott wave analysis terms would typically be labeled Wave ii of 5). After point 14, the market shoots higher into point 15. Lindsay labeled this advance the "Wall of the First Story." Elliott would undoubtedly have called it a wave iii of 5. The "Roof of the First Story" follows, and typically takes the form of a flat or expanding zigzag with at least 5 reversals (down into point 16, up to 17, down to 18, up to 19, and down to 20). After the fifth reversal is achieved at point 20, the main uptrend is resumed into what Lindsay referred to as the "Wall of the Second Story." In Elliott terms, the diagonal triangle would of course be labeled a iv of 5 wave, and the "Wall of the Second Story" would be the beginning of the final v of 5 advance. The advance that begins at point 20 has one major hesitation at point 21, a potentially sharp decline into point 22, and then a final rush up to point 23 before quickly falling back to point 24, retracing practically the whole move from point 22 to 23. Prices hold up and typically rally a little until point 25, leaving an imaginary line that could be drawn through points 21 and 23 that marks the edge of the "Roof to the Second Story." Falling back from point 25 and penetrating this line leaves an overall formation that suggests a cupola or small dome on top of a building, and thus the reference to a "Domed House." In traditional technical analysis, one might often hear this referred to instead as a Head and Shoulders top. A significant and lasting decline then commences immediately thereafter. Lindsay spotted this idealized formation on several different occasions in the chart of the DJIA between 1906 and the early 1960's, some with small variations to the idealized pattern, but none with more significance than the point 23 high made on September 3, 1929. CHART NOTES ( NOV 16 2007 ) SOME VERY LONG TERM PRICE LEVELS HAVE BEEN REACHED WITH THE DOW HITTING 14198.10 IN LATE OCT 2007 IDEAL TIME FRAME FOR THE PEAK IS STILL LATE 2009 TO MID 2010 BEFORE ANY REAL HARD DOWN TURN BASED ON THESE LONGER TERM TIME SPANS . THAT SAID THE DOW WILL HAVE A HARD TIME MAKING ANY NEW ALL TIME HIGHS GOING FORWARD . ( A LONG TERM BEAR MARKET IS IN IT'S EARLY STAGES ) ( A B WAVE TOP SIMILAR TO THE B WAVE TOP IN 1968-1969 WOULD CALL 14702-14807 A MAX LEVEL IN JUNE 2010 ) FROM JUNE 2010 TO 2015-2017 LOOK FOR THE DOW TO TEST THE LONG TERM TREND LINE AT 6000 ( BELOW THERE TARGETS 1000 ) THINK OF 1929-1932 WHEN THE DOW LOST 89 PERCENT . 14807 * .89 = 13209 PTS DOWN ( DOW 1597.59 ) THIS IS ALSO THE PREVIOUS 4TH WAVE OF THE NEXT LARGER DEGREE ADDED NOTE MAY 23RD 2008 JULY 1932 TO JAN 1966 WAS 32 1/2 YRS BOTTOM TO TOP FROM JAN 1966 TO JUNE 1999 WAS 32 1/2 YRS BOTTOM TO TOP JUNE 1999 THE DOW CLOSED AT 10970.80 AND HAD MANY HARD TIMES CLOSING ABOVE THAT LEVEL ON A MONTHLY BASES UNTIL FEB 2006 ( NEARLY 7 YEARS ) FROM THE 1974 LOW TO MAY 2008 WAS ANOTHER 32 1/2 YEAR PERIOD
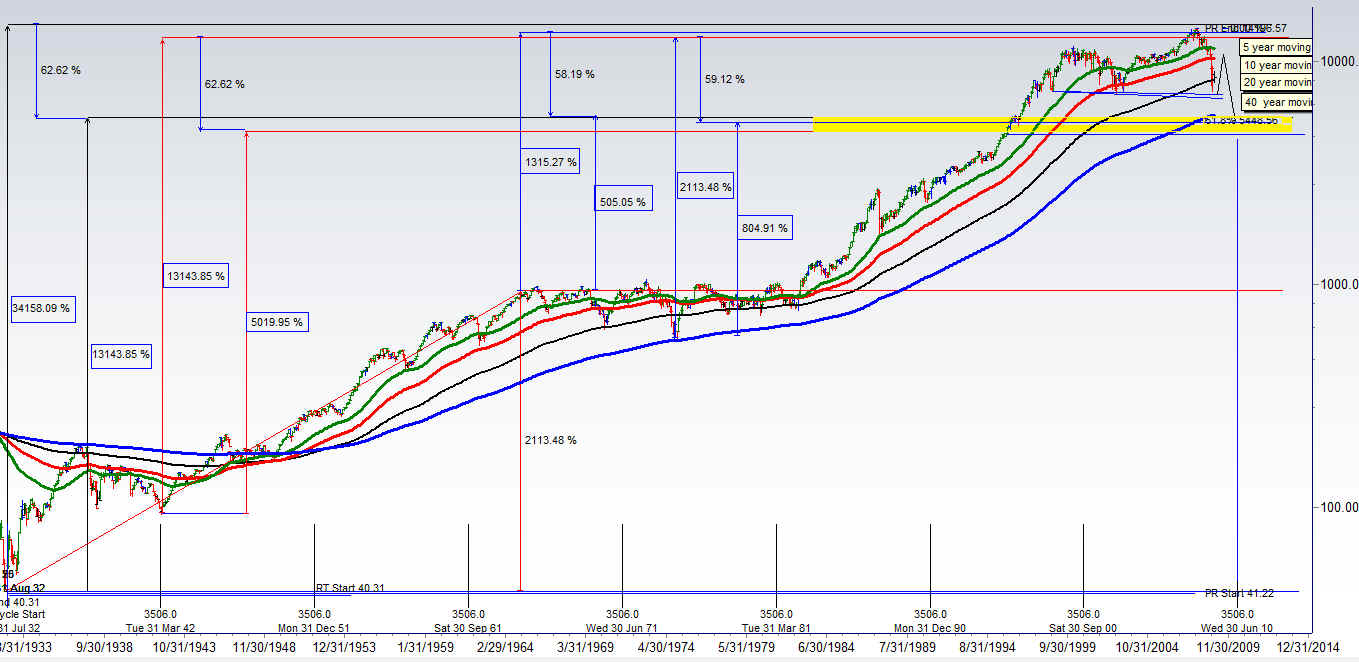
LONGER TERM BEAR MARKET PATTERN THIS CHART IS A REFERENCE CHART APRIL 11 DOW LOW 6469.95 , 25 PERCENT UP = 8087.43, 50 PERCENT UP = 9704.92 .
LONG TERM SUPPORT AREA SURROUNDS THE 5448.56 TO 4719.72
12 YEAR CYCLE JUNE 2010 AS NOTED ABOVE SHOWS UP AGAIN YET AS A TOP . WAVE 1 WOULD BE A LEADING DIAGONAL , THIS WOULD EXPLAIN 5 WAVES DOWN INTO MARCH 2009
THERE IS RISK IN TRADING . PLEASE DO YOUR OWN RESEARCH BEFORE TRADING PAST PERFORMANCE IS NO GUARANTEE OF FUTURE RESULTS . THE INFORMATION ON THIS PAGE IS INTENDED AS A GUIDELINE AND IS NOT A SPECIFIC BUY OR SELL RECOMMENDATION .
Copyright © 2004 CompanyLongName Last modified: March 21, 2010 |

|